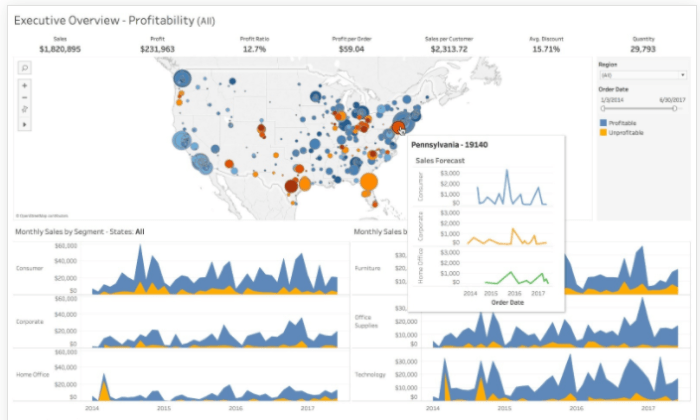
Using Data Visualization Tools at the forefront, get ready to dive into the world of visual data representation. From charts to graphs, this guide will show you how to make sense of complex data in a whole new way.
Let’s explore the power of visualization and how it can revolutionize the way we understand and analyze information.
Introduction to Data Visualization Tools

Data visualization tools play a crucial role in presenting complex data in a clear and understandable format. These tools help transform raw data into visual representations, such as charts, graphs, and maps, making it easier for users to identify patterns, trends, and outliers.
Popular Data Visualization Tools
- Tableau: Known for its user-friendly interface and powerful features, Tableau is widely used in various industries for data analysis and visualization.
- Power BI: Developed by Microsoft, Power BI is a popular tool for creating interactive reports and dashboards to gain insights from data.
- Google Data Studio: A free tool by Google that allows users to create customizable reports and visualizations using data from various sources.
Benefits of Using Data Visualization Tools
- Enhanced Decision Making: Data visualization tools enable users to make data-driven decisions by providing a clear overview of the data, helping in identifying trends and patterns.
- Improved Communication: Visual representations make it easier to communicate complex information to stakeholders, facilitating better understanding and collaboration.
- Time-Saving: By automating the process of data analysis and visualization, these tools save time and effort, allowing users to focus on interpreting insights and making informed decisions.
Types of Data Visualization Tools

Data visualization tools come in various forms to help users interpret and present data effectively. Let’s explore the different types of data visualization tools available and their unique features.
Charts and Graphs
Charts and graphs are common types of data visualization tools that are used to represent numerical data visually. They can include bar charts, line graphs, pie charts, and more. These tools are effective for comparing different data points and trends at a glance.
Maps
Maps are another type of data visualization tool that is useful for representing geographical data. They can show spatial relationships, distribution patterns, and location-based insights. Interactive maps allow users to explore data in a dynamic and engaging way.
Interactive vs. Static Tools
Interactive data visualization tools allow users to manipulate and explore data dynamically. Users can interact with the visualizations, filter data, and drill down into specific details. On the other hand, static tools generate fixed visualizations that do not allow for user interaction.
Specialized Tools for Specific Data Types
There are specialized data visualization tools designed for specific data types, such as network data and time-series data. For example, Gephi is a popular tool for visualizing network data, while Tableau is commonly used for analyzing and visualizing time-series data.
Best Practices for Using Data Visualization Tools
When working with data visualization tools, it is crucial to follow best practices to ensure accurate and effective visualizations. Here are some key techniques and tips to keep in mind:
Choosing the Right Data Visualization Tool
One of the most important aspects of using data visualization tools is selecting the right tool for the job. Consider the type of data you are working with, the intended audience, and the story you want to convey through the visualization. Some tools may be better suited for specific types of data or visualizations, so it is essential to research and test different tools before making a decision.
Importance of Data Accuracy and Integrity
Accuracy and integrity of data are paramount when creating visualizations. Garbage in, garbage out – if the data input is incorrect or incomplete, the visualizations will not accurately represent the information. It is crucial to double-check the data sources, clean the data, and ensure that the visualizations are based on accurate and reliable information.
Tips for Designing Effective and Engaging Visualizations
Designing visually appealing and engaging visualizations can enhance the impact of your data insights. Consider the audience you are targeting and tailor the visualizations to their preferences and understanding. Use colors, labels, and interactive elements wisely to make the data more accessible and easy to interpret. Remember to keep the design clean and uncluttered, focusing on the key message you want to convey.
Data Visualization Tools in Action: Using Data Visualization Tools
Data visualization tools play a crucial role in transforming raw data into meaningful insights that drive decision-making processes. Let’s explore how these tools have been utilized effectively in real-world scenarios.
Case Study: Sales Performance Analysis
- One company utilized data visualization tools to analyze their sales performance across different regions.
- By creating interactive dashboards and visual representations of sales data, the company was able to identify trends and patterns that were not evident in traditional reports.
- As a result, the sales team was able to adjust their strategies in real-time, leading to a significant increase in sales and market share.
Simplifying Complex Data
- Data visualization tools have the ability to simplify complex data sets by presenting information in a visually appealing and easy-to-understand format.
- Through the use of charts, graphs, and heat maps, complex datasets can be transformed into interactive visualizations that highlight key insights at a glance.
- This simplification of data allows decision-makers to quickly grasp important information and make informed choices based on the data presented.
Real-Time Decision-Making
- Real-time data visualization tools have revolutionized decision-making processes in organizations by providing up-to-the-minute insights into key metrics and performance indicators.
- With the ability to monitor data in real-time, businesses can quickly identify emerging trends, respond to changing market conditions, and make informed decisions on the fly.
- By leveraging real-time data visualization tools, organizations can stay ahead of the competition and adapt swiftly to dynamic business environments.